I am using 3 routers with Cisco IOS 15.0 code for this demo. Note that IOS XE routers have a different approach than this. Also I use my laptop as TFTP Server which I use to export and view captured packets.
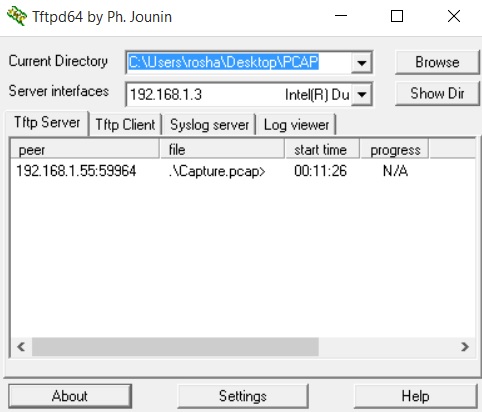
TFTP software used is TFTPD64 which is configured as the server interface to be the IP address of my laptop's network card.
Captured files will be exported into the folder named PCAP on the desktop.
Setup is simple as shown in the diagram below.
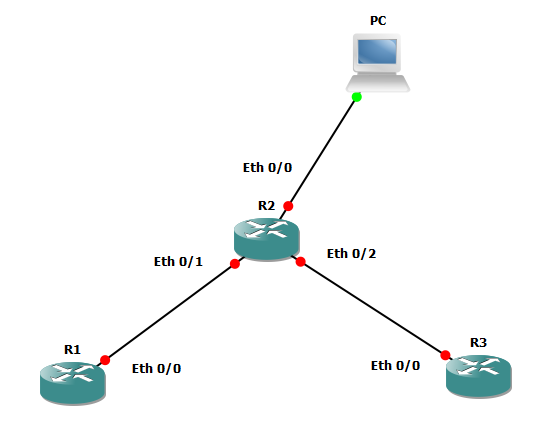
IP address are;
R1 e0/0 : 1.1.1.1
R2 e0/0 : 192.168.1.55
e0/1: 1.1.1.2
e0/2: 1.1.2.2
R3 e0/0 : 1.1.2.1
PC: 192.168.1.3
Routers are running EIGRP
1) Define Capture Buffer
2) Define Capture Point
3) Associate Capture Point with Capture Buffer
4) Start Capture & End Capture
5) Export to server
Now you can open it in Wireshark..
To see capture works before exporting you can use;
R2#show monitor capture buffer all parameters
TFTP software used is TFTPD64 which is configured as the server interface to be the IP address of my laptop's network card.
Captured files will be exported into the folder named PCAP on the desktop.
Setup is simple as shown in the diagram below.

IP address are;
R1 e0/0 : 1.1.1.1
R2 e0/0 : 192.168.1.55
e0/1: 1.1.1.2
e0/2: 1.1.2.2
R3 e0/0 : 1.1.2.1
PC: 192.168.1.3
Routers are running EIGRP
Steps:
1) Define Capture Buffer
2) Define Capture Point
3) Associate Capture Point with Capture Buffer
4) Start Capture & End Capture
5) Export to server
Configuration:
Capturing both in/out traffic at E0/1 in R2
R2#monitor capture buffer PCAP
R2#monitor capture point ip cef CAP_POINT e0/1 both
R2#monitor capture point associate CAP_POINT PCAP
R2#monitor capture point start CAP_POINT
R1#ping 1.1.2.2
R2#monitor capture point stop CAP_POINT
R2#monitor capture buffer PCAP export tftp://192.168.1.3//Capture.pcap
There are more options to define buffer size etc in command line. Also you can specify Access Control Lists to capture the exact packets you want.
And also you can view captured packets in CLI too but it is more easy with Wireshark to analyze.

R2#monitor capture buffer PCAP
R2#monitor capture point ip cef CAP_POINT e0/1 both
R2#monitor capture point associate CAP_POINT PCAP
R2#monitor capture point start CAP_POINT
R1#ping 1.1.2.2
R2#monitor capture point stop CAP_POINT
R2#monitor capture buffer PCAP export tftp://192.168.1.3//Capture.pcap

There are more options to define buffer size etc in command line. Also you can specify Access Control Lists to capture the exact packets you want.
And also you can view captured packets in CLI too but it is more easy with Wireshark to analyze.

Now you can open it in Wireshark..
To see capture works before exporting you can use;
R2#show monitor capture buffer all parameters


